
The App Server or VDI tab is displayed based on the session type you are viewing (VDI for a virtual desktop session, App Server for published apps and desktops). This tab displays resource and metrics for the user’s virtual machine in a VDI environment or the user’s session host in a XenApp environment. From here you can determine if the problem with the user’s experience is related to the performance of the Desktop\Server the user is logged into.
Figure 1: VDI tab in a virtual desktop session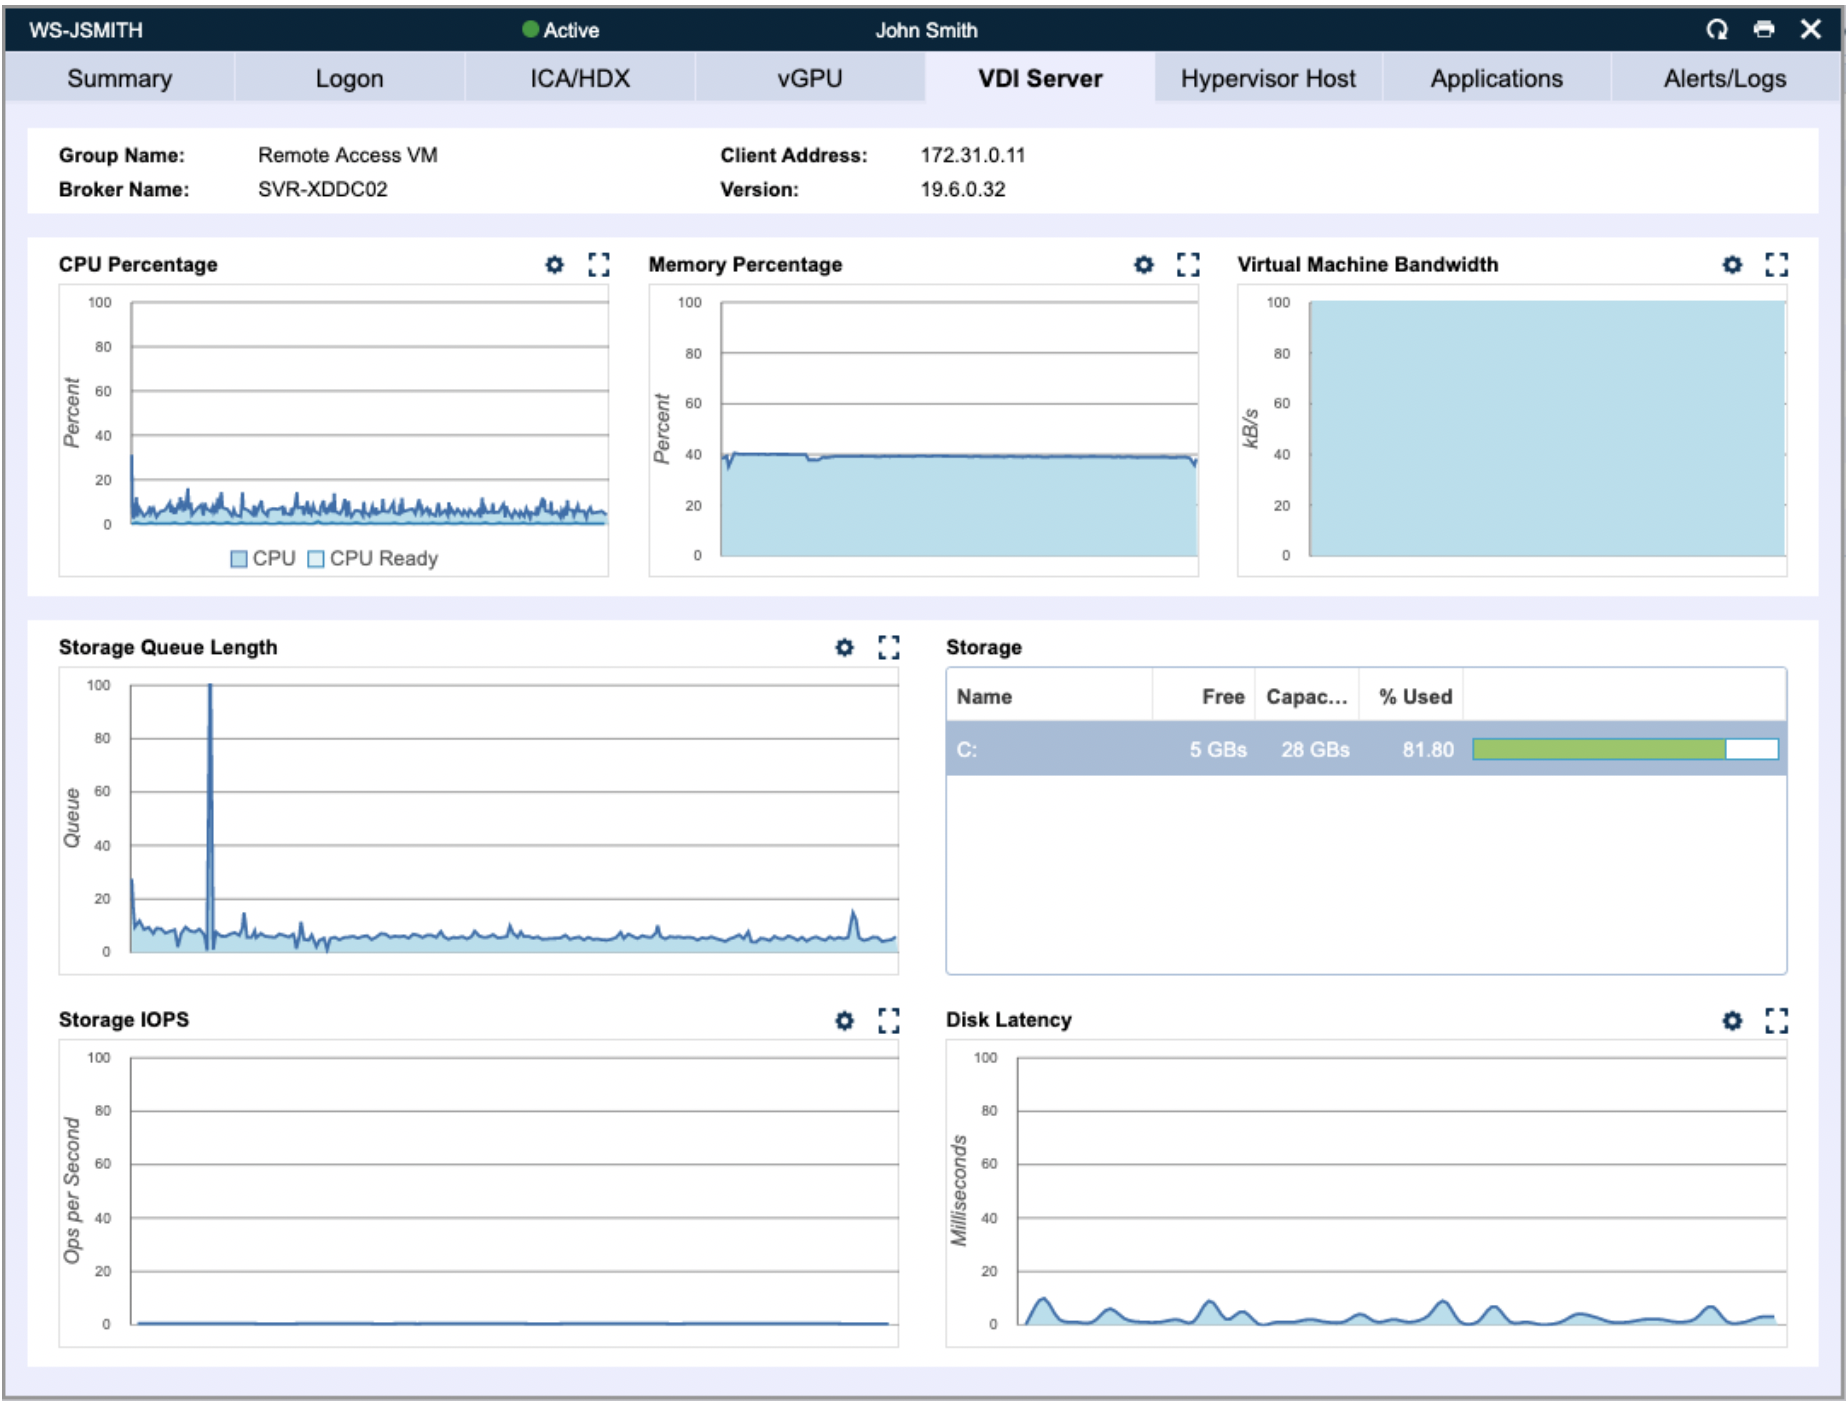
CPU, Memory and Network Utilization
- CPU Percentage: Current and historical CPU load for the virtual machine.
- Memory Percentage: Current and historical memory usage foe the virtual machine.
- Virtual Machine Bandwidth: Network bandwidth consumed by the virtual machine.
|
How to Troubleshoot: This data is handled in similar to how you would troubleshoot a user’s PC regarding performance. If CPU or memory are high you will want to investigate why by navigating to the application tab to find the problem application or process. |
Storage Utilization
- Storage Queue Length: the number of requests outstanding on the disk at the time the performance data is collected. This means that the disk is not able to honor I/O requests as fast as they are being made
- Storage: The amount of storage used and free on the virtual machine.
- Storage IOPS: The amount of read write operations performed per second.
- Disk Latency: The measure of the time required for a system to process a single storage transaction or data request.
|
How to Troubleshoot: Disk latency is the most important metric here outside of your disk being out of space. High disk latency coupled with high disk IOPS would indicate your storage is the bottleneck. If you are experiencing this type of issue you may want to look at the Hypervisor Host tab and check for other virtual machines with high storage IO. Alternatively, you may need to step out of the user’s session data and investigate if your host is the issue or the underlying datastore or LUN. |