
Combining in-depth Citrix data and Windows OS logging data, the Logon tab breaks down the user’s login from start to finish, providing the administrator with actionable metrics to reduce troubleshooting times.
The Logon tab is comprised of four main sections displaying a wide variety of data to assist in diagnosing slow logon times. Each of the logon stages is presented with easy to identify graphs to quickly see where the majority of time is spent in the process, saving you time getting to the root cause of potential problems.
Figure 1 - Session dialog - the Logon tab at a glance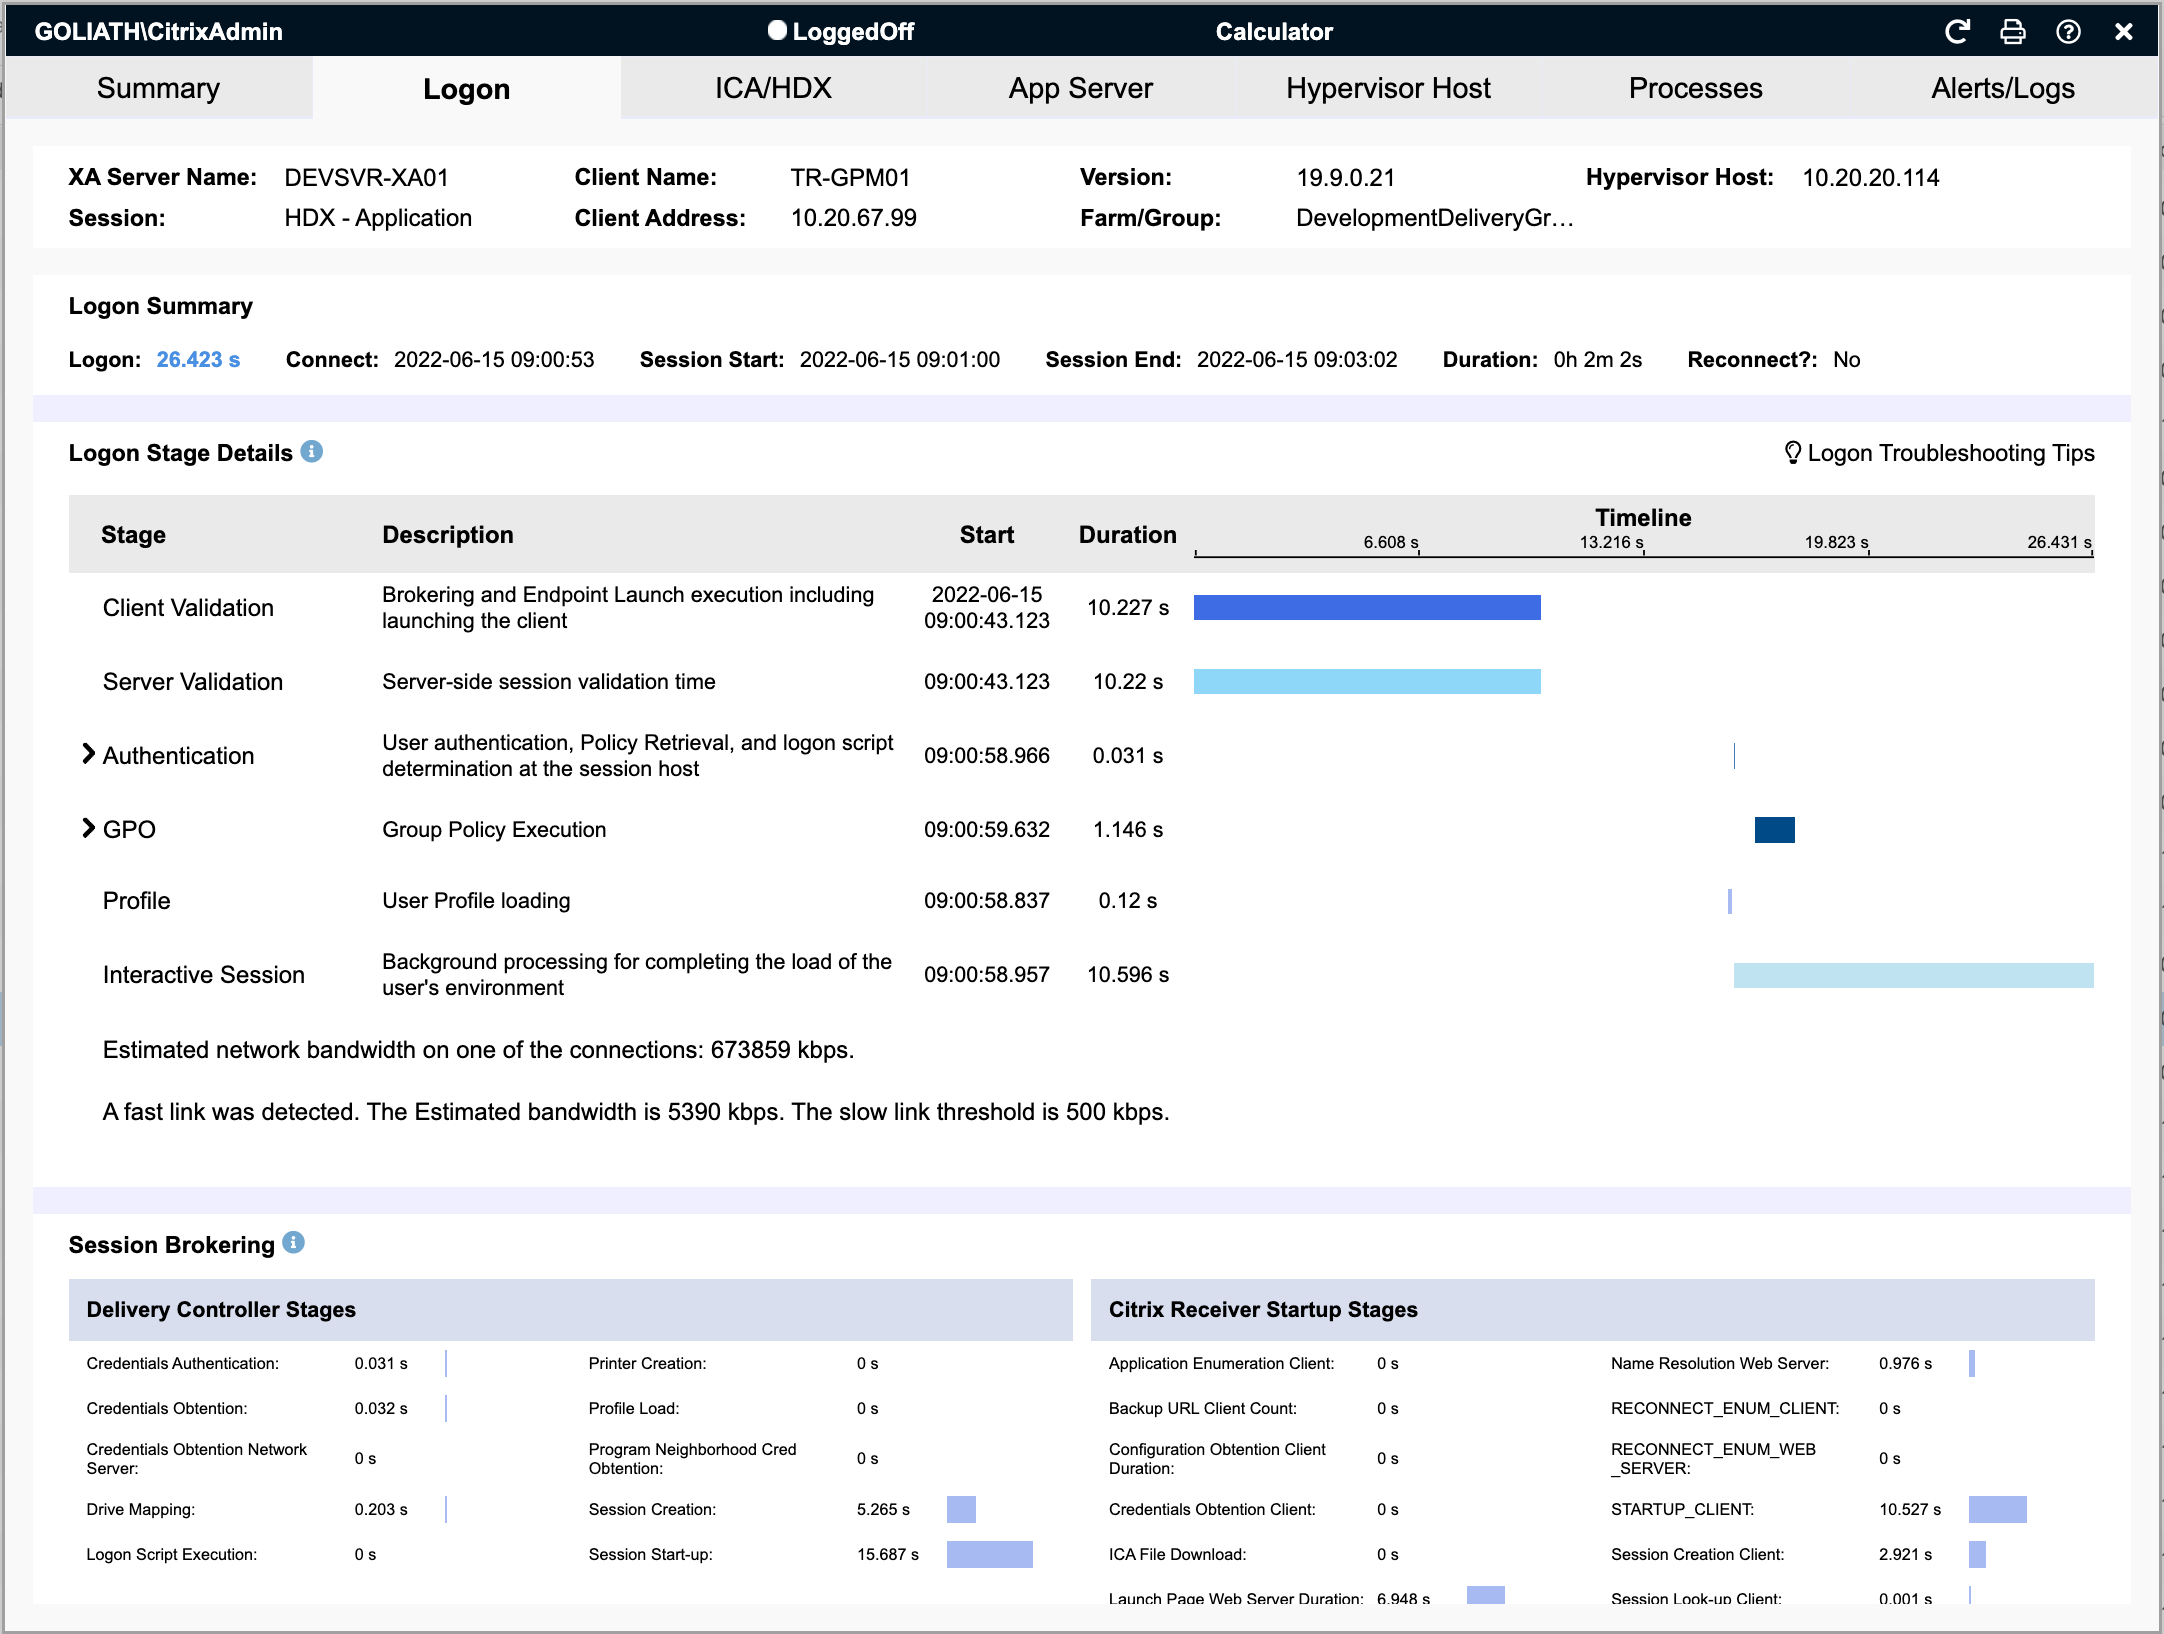
From the top of the dialog, the first section presents general session information. This information will differ if you're reviewing a Published app or desktop session versus a Virtual Desktop. The example in Figure 2, below, displays a Virtual Desktop session, which includes the Delivery Group name, the endpoints IP address, the Citrix broker responsible for the connection and the version of Citrix Workspace the endpoint has installed.
Figure 1.a - Virtual Desktop session information
The next area is a Logon summary where you can find actual logon duration time as well as session start, duration, and end time if applicable. the Logon time is the time from when a user initiates the Citrix session until they have keyboard and mouse control within that session.
Multiple factors impact logon times, many of which are captured within the stage information below. Policy configuration, network latency, and even failing to open the Citrix launcher after initiating a session can all impact the logon times. Using the data below and relevant environmental or other information from your users when possible will help in troubleshooting and getting to root cause of long logon times.
Figure 1.b - Logon summary 
Logon Stage Details
The Logon Stage Details section of the Logon tab is unique to Goliath Performance Monitor. It presents a granular breakdown of the login process by combining all of the above metrics with information included in the Goliath logs. This approach saves time and testing efforts by highlighting specific details during the login process that an administrator would normally have to dig through logs and other areas to obtain.
Figure 5: Logon Stage Details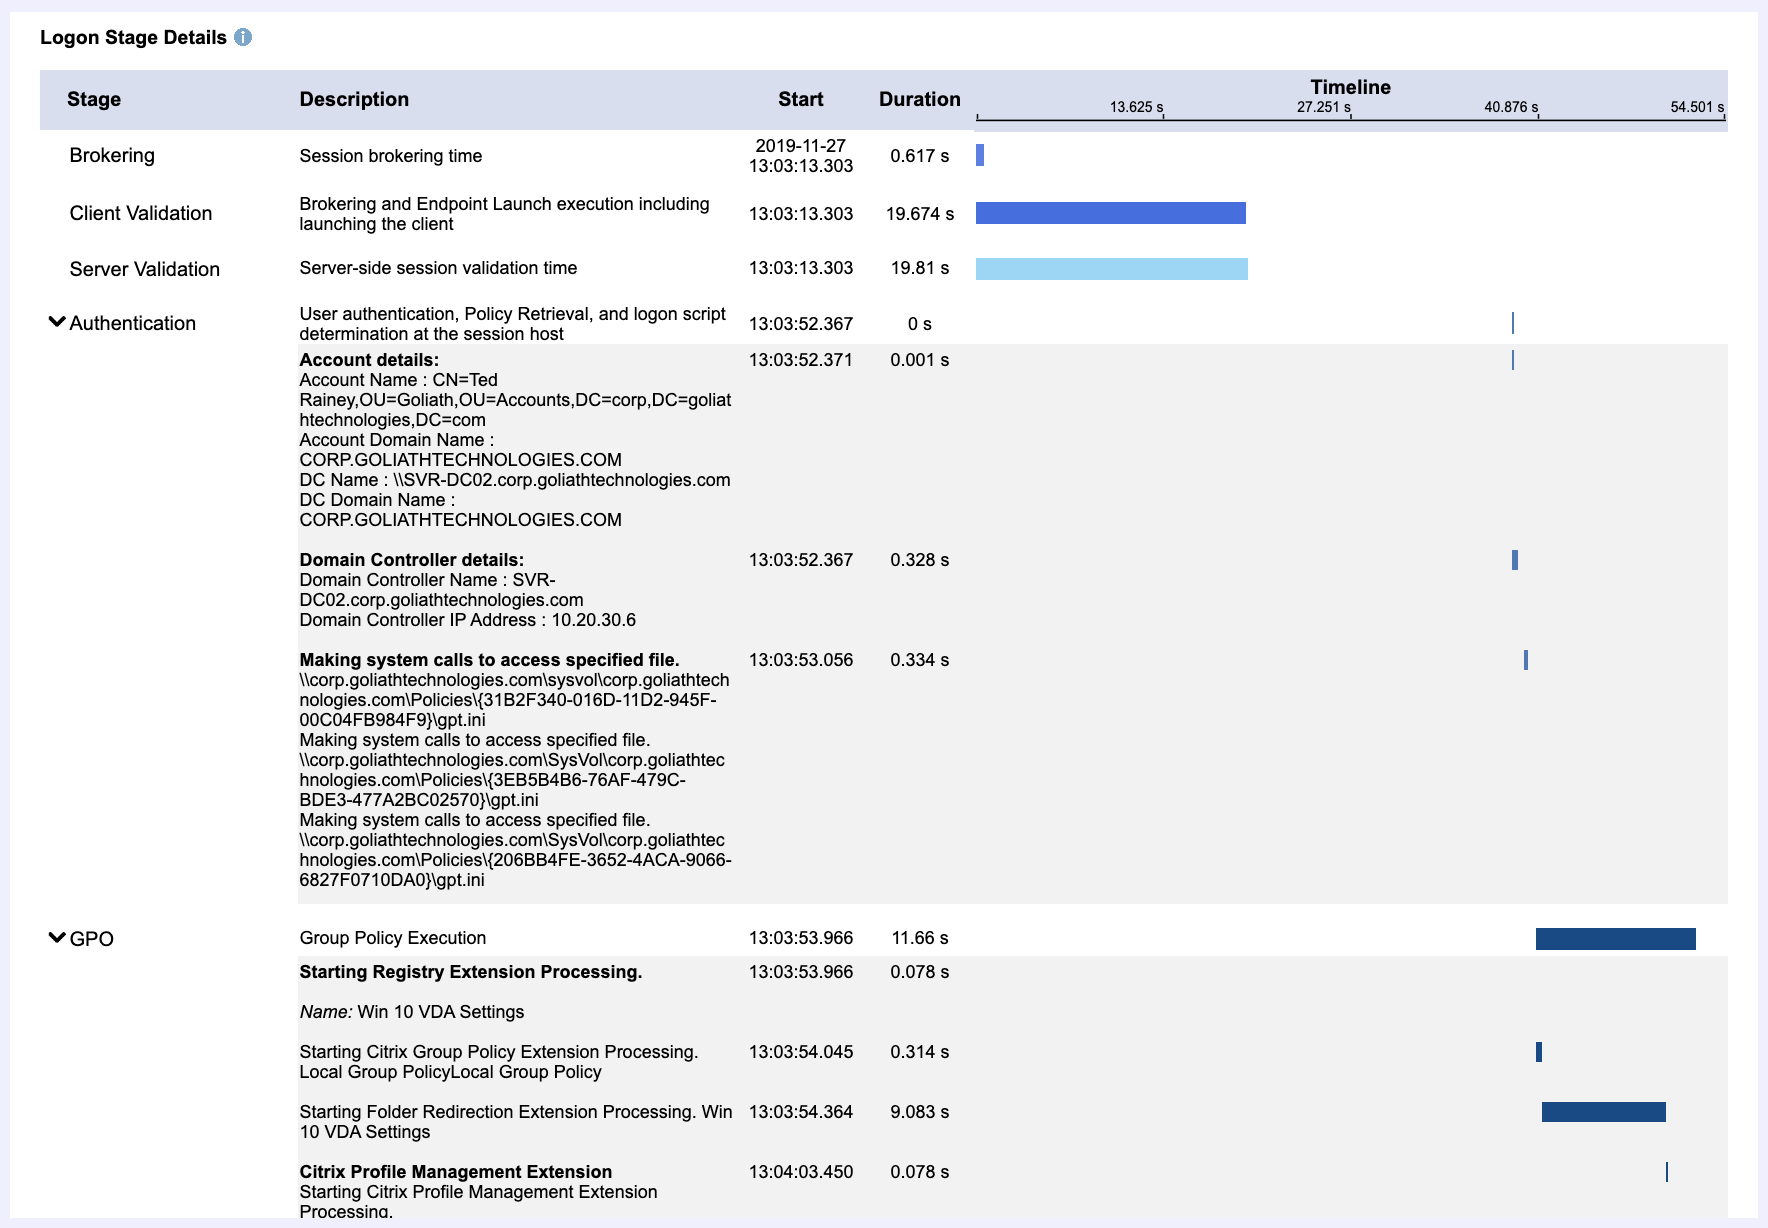
As seen in the image above, some of the stages of the logon process can be expanded to drill in to specifics about the individual logon stage process.
Note that some of the stages described below may not be present depending on your specific Citrix configuration (for example, the VM Start stage is only displayed when a VM is required to be started for the session).
The table below includes descriptions and additional details for each stage.
| Brokering | Time taken to assign resources to the user. |
| VM Start |
Time taken to start a virtual machine if required for the session. If encountering longer times than usual, check the VM Host metrics and available resources. Check shared storage, and ensure CPU memory, IOPs are not over provisioned. Additionally, try to boot another VM on the same host, add more RAM to test. |
| Client Validation | Brokering and endpoint launch execution including launching the client. This phase begins at log on time and ends when validation is complete. |
| Server Validation | Server-side session validation time. This phase begins at log on time and ends when validation is complete. This step also includes any idle time from the ICA file download and ICA file launch on the endpoint device. When auto launch is not configured, longer times here can indicate users starting a session and then delaying to launch the ICA file manually. |
| HDX | Time taken to set up HDX connection from the client to the VM. |
| Authentication |
Time taken to complete the authentication to the remote session. Click to expand this phase for additional details. Typically, issues in this phase are dependent on the authentication technique in use. Check for issues related to Active Directory, connectivity to remote authentication mechanisms (for example, Azure AD), domain trust issues when using a different domain from the VDA, or Citrix FAS, if configured. |
| GPO | Time taken to apply Group Policy objects during logon, if required. Click to expand this phase for additional details. For troubleshooting GPO phase issues, you can run RSOP on user sessions or use Goliath or Citrix Director to verify which policies are being applied. Review for conflicting policies, check for invalid policy settings (non-existent drive mapping for example), WMI filtering issues, and security groups. |
| Logon Scripts | Time taken to execute logon scripts, if required. Troubleshooting tips: Check to verify “Configure Logon Script Delay” is disabled (server 2012/8.1). Run the script manually in user context to check for issues with permissions or execution and test the time it takes to run. If using UPM, Setting “Delete Cached Profiles” and GPO RSOP logging is DISABLED, logon scripts will not run. |
| Profile | Time taken to load the user profile, if required. This time is increased when Citrix Profile Management is configured. Resolving user profile issues typically includes resetting user profiles, removing unwanted large files, reducing number of files, and using profile streaming. When long Profile times are encountered, start with verifying best practices for Citrix Profile management store/server are in place. In addition there are many other areas to review and options you can take including: check security permissions, reset the profile, check for file locks, IOPS on profile server, logon time (example, boot storms in the morning). Ensure Antivirus settings meet Citrix best practices. Review how Profile Management is configured (settings) and method (WEM, CtxPolicy, GPO). Review profile sizes. |
| Interactive Session | The total time required to hand off keyboard and mouse control to the user. This is normally the longest phase of the logon process. Make sure Audit process tracking on the VM/VDA is set to "AUDIT SUCCESSES" to get subprocess information. |
The Server Validation and Client Validation stages provide the times taken brokering the session between client and servers.
Phases of the logon process that go into Client Validation and Server Validation include, but are not limited to, following the user clicking on their desktop or application, are:
- Storefront requests a session host from the Delivery Controller
- Delivery Controller selects a session host
- Delivery Controller sends session hostname & IP address to storefront
- Storefront creates the ICA File and sends it to Citrix Workspace
- Citrix Workspace launches the ICA File
- Citrix Workspace determines and then checks that the connection to the session host can be established
- Citrix Workspace establishes and ICA connection to the session host
- Delivery Controller creates a user’s session
- Delivery Controller processes Citrix policies
- Session is brokered by the Delivery Controller to the session host
- User authentication between domain controller and session host
|
How to Troubleshoot: A few areas that are helpful to look at when analyzing why there are long Client Validation and Server Validation times include, but are not limited to:
|
The Authentication section is key to determining which domain controller processed the login as well as the time it took to read group policy objects. One of the key metrics here are is the domain controller’s location. An improper site configuration could have a client authenticating through a domain controller not local to the client. Another key metric would be the client’s ability to read the Group Policy file and how long that read takes.
The GPO section displays the amount of time to process each group policy. Long GPO processing could indicate invalid printer mapping and network drive mapping.
In summary, Goliath Performance Monitor's Logon tab provides administrators with a unique view into the login process by combining data from Citrix as well as Windows log information to assist in troubleshooting slow logons and getting to root cause much faster.
Example Troubleshooting Scenarios
Figure 6, below, depicts a real-world example of how the GPO stage identifies the root cause for slowness issues during a user's logon. This stage breaks out each policy name, the times each one takes, and a line graph providing an at-a-glance view of the total duration.
In this example, you can see that a VDI drive map added 180 seconds (indicative of a three minute timeout) which means the drive may not be available.
Figure 6: GPO Section of Logon Stage Details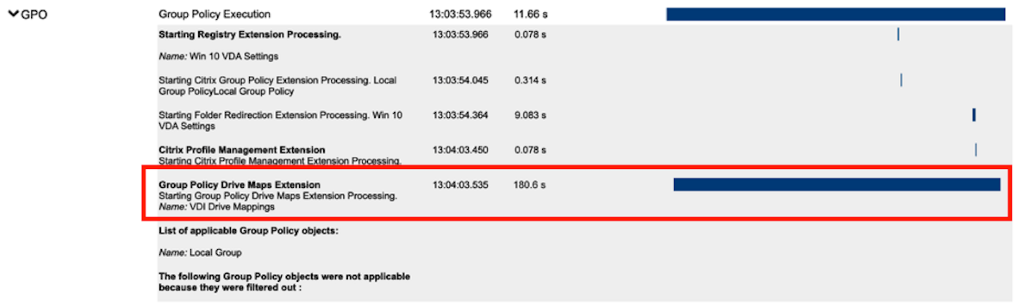
Understanding Logon Stages and Logon Duration
In some cases, logon stage durations may not add up to to, or may exceed, the reported Logon duration time. This can be due to multiple factors, including:
- Citrix versions out of date or mismatched. Ensure all Citrix components and agents are up to date and consistent. Out dated versions can cause Citrix to incorrectly report stage data for the session.
- Parallel processing of stage data. Many stages in the log on process happen simultaneously which can impact how stage data is perceived relative to the logon time.
- In some stages more processing occurs resulting in a longer logon duration than the total displayed.
Session Brokering Stages
The middle section of the Logon tab displays the session brokering stage data for both the delivery controller and the Citrix Workspace startup stages.
VDA Startup Stages
Figure 1.c - VDA Startup Stages
- Credentials Authentication:
- The time spent on the server authenticating the user credentials against Active Directory.
|
How to Troubleshoot: A slow authentication stage may indicate an improper site configuration. An example would be if your user is logging into a data center in one location and is being authenticated by a domain controller in another physical location. Another point to consider would be a site DNS issue. |
- Credentials Obtention:
- The time taken for credentials to be passed through to the server. This is only likely to be a significant amount of time if a manual logon is used and the server side credentials dialog is displayed (or if a legal notice is displayed before the logon commences.) Additionally, check DC for authentication issues or other problems, verify DNS working on SF, DDC, VDA’s, Check location authentication is occurring (proper DC geographically. You can also login to the VDA directly (RDP) to see if issue occurs outside of Citrix, reboot server and retest above.
|
How to Troubleshoot: First test to make sure authentication mechanism (AD for example, or Azure AD) is running properly for the environment. Review at the DDC, storefront, and VDA to see if any Kerberos, AD, or SSPI errors were logged. Additionally, check how FAS/Passthrough/2FA could be affecting this. |
- Credentials Obtention Network Server:
- Network credential retrieval for pass-through authentication.
- Drive Mapping:
- Client pass-through drives, port and device mapping.
|
How to Troubleshoot: Create policies to disable unnecessary ports, drives and devices. Verify policies applying to session (ctxPolicies, GPO) and look for invalid drive map/ports/devices. Are appropriate policies applying? Can additionally check GPO info displayed in the GPO stage. You can test for issues by disabling drive mapping for the user in policy, remove single items from mapping, disable all unnecessary mapping settings in CtxPolicies. For missing policies, validate Citrix Workspace app settings (can be accessed via the toolbar within session). |
- Login Script Execution:
- Time spent executing user login scripts.
|
How to Troubleshoot: Find scripts executed by the user and manually run them to observe how long they take to execute and observe failures in execution that may cause delays. Check to verify “Configure Logon Script Delay” is disabled (server 2012/8.1). Run the script manually in user context to check for issues with permissions or execution and test the time it takes to run. If using UPM, Setting “Delete Cached Profiles” and GPO RSOP logging is DISABLED, logon scripts will not run. |
- Printer Creation:
- The time spent mapping the user’s client printers.
|
How to Troubleshoot: Check for network or other printers that no longer exist at the specified IP and delete or update that printer object on client. Check the wait for printers vs start app without printers options based on needs. Make sure Direct Connections to printers is disabled, as this will require a check to see if the driver is on your Citrix server. |
- Profile Load:
- The time spent loading the user’s profile.
|
How to Troubleshoot: Check the size of the user’s roaming profile. Find large folders and work on creating policies to reduce the number of folders and files included in the profile. Resolving user profile issues typically includes resetting user profiles, removing unwanted large files, reducing number of files, and using profile streaming. When long Profile times are encountered, start with verifying best practices for Citrix Profile management store/server are in place. In addition there are many other areas to review and options you can take including: check security permissions, reset the profile, check for file locks, IOPS on profile server, logon time (example, boot storms in the morning). Ensure Antivirus settings meet Citrix best practices. Review how Profile Management is configured (settings) and method (WEM, CtxPolicy, GPO). Review profile sizes. |
- Session Creation:
- The time the server spends creating the session.
|
How to Troubleshoot: Issues with session creation can span multiple areas of the Citrix infrastructure. Check for general issues with StoreFront, VDA, licensing, XML trust. |
- Session Startup:
- This is the high-level server-side connection start-up metric that encompasses the time XenDesktop takes to perform the entire start-up operation. When an application starts in a shared session, this metric is normally much smaller than when starting a new session, which involves potentially high cost tasks such as profile loading and login script execution.
Citrix WorkSpace Startup Stages
Figure 1.c - Citrix Workspace Startup Stages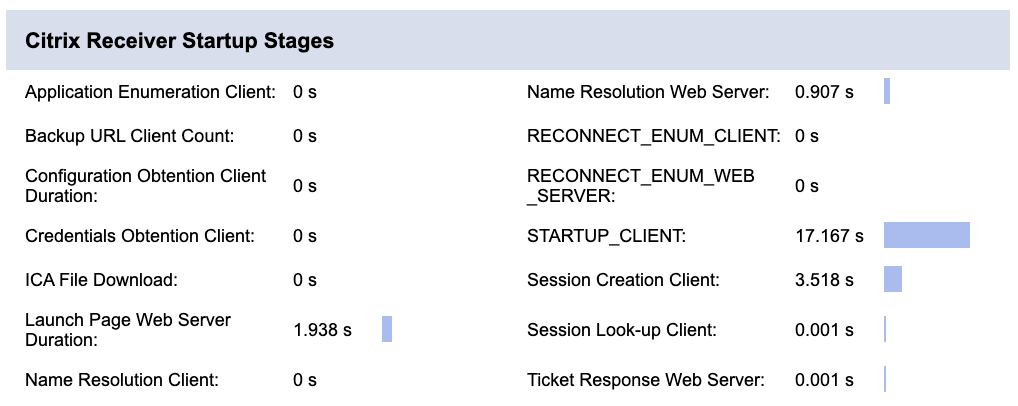
- Application Enumeration Client:
- Application enumeration is one of the issues slowing down session start times.
- Backup URL Client Count:
- If this metric has a value higher than 1, it indicates the Web Interface server is unavailable and the Citrix Workspace is attempting to connect to back-up Web Interface servers to launch the application.
- Configuration Obtention Client Duration:
- The time it takes to get the configuration file from the XML server
- Credentials Obtention Client:
- The time it takes to obtain user credentials when the user credentials are manually entered by the user.
- ICA File Download:
- The time it takes for the client to download the ICA file from the server.
- Launch Page Web Server Duration:
- Review the information for IFDCD. The LPWD metric is only used when Web Interface is the application launch mechanism.
|
How to Troubleshoot: Check for high loads on storefront server and identify causes of slowdowns using IIS logs and Windows Monitoring tools, like Task Manager, PerfMon, ProcessMon. Also look for host/VM level resource issues. Additionally check storefront for communication issues with Delivery Controller or if Delivery Controller(s) are overloaded. |
- Name Resolution Client:
- This metric is collected when a client device directly queries the XML Broker to retrieve published application information stored in IMA (for example, when using Program Neighborhood or a Custom ICA Connection). NRCD is only gathered for new sessions since session sharing occurs during startup if a session already exists.
|
How to Troubleshoot: When the Name Resolution Client metric is high, it indicates the XML Broker is taking a lot of time to resolve the name of a published application to an IP address. Possible causes include a problem on the client, issues with the XML Broker, such as the XML Broker being overloaded, a problem with the network link between the two, or a problem in IMA. Begin by evaluating traffic on the network and the XML Broker. |
- Name Resolution Web Server:
- When this metric is high, there could be an issue with the Web Interface server or the XenApp plugin site (formerly known as the Neighborhood Agent site), the XML Service, the network link between the two, or a problem in IMA.
|
How to Troubleshoot: Like Name Resolution Client, this metric indicates how long it takes the XML service to resolve the name of a published application to a XenApp IP address. However, this metric is collected when a Web Interface site is performing this process on behalf of a launch request it has received from either the XenApp plugin (previously known as Program Neighborhood Agent) or from a user clicking a Web Interface page icon. This metric applies to all sessions launched through the Web Interface or the Citrix Online Plugin (formerly, the Program Neighborhood Agent). |
- Reconnect Enum Client:
- The time spent for the user’s client to get a list of reconnect-able sessions.
|
How to Troubleshoot: Typically issues here indicate problems with resources available on the DDC and network issues. Check for resource usage and over provisioning of servers within Citrix environment. |
- STARTUP CLIENT
- The time it takes the Web Interface to get the list of reconnections for this user from the XML service.
- Session Creation Client:
- The time it takes to create a new session, from the moment wfica32.exe is launched to when the connection is established.
- Session Lookup Client:
- The time it takes to query every session to host the requested published application.
|
How to Troubleshoot: For STARTUP CLIENT, Session Creation Client, Session Lookup Client stages, review resources and check for registration issues related to the VDA, non-responsive VDA or DDC. Network problems additionally impact this stage time. |
- Ticket Response Web Server:
- The time it takes to get a ticket from the STA server or XML service.
|
How to Troubleshoot: This can indicate that the Secure Ticket Authority server is overloaded. |