
This article was updated to support v12.0 of Goliath Performance Monitor.
This article will guide you through the process of configuring syslog notifications.
Configure Syslog Notifications
- Open the Goliath Console
- Navigate to the Configure - Monitoring Rules page
- Select the alert condition(s) in which you’d like to enable notifications
- Click the Edit button
- A new pane will open, go to the Notifications tab
-
The subsection for Email will be selected by default, on this tab please use the Email Subject field to define the subject for the syslog message.
- In order to edit the subject you must first check the box to enable email notifications, update the subject, and then check the box again to disable email notifications
- Please note, by default you will see characters like ‘&N’ in the subject, this is a part of our macro functionality. A full list of macros is provided in the Appendix at the end of this document.
- Click the Syslog tab and select the checkbox at the top of the subsection to enable syslog
-
In the Syslog Server Address field, define the IP address or machine name where the syslog alert notification will be sent.
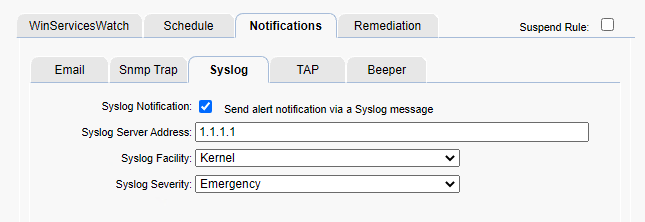
- For the Syslog Facility drop down menu, chose the Facility that defines where the Syslog message is originating. This field is used in conjunction with the Severity field to form the syslog message priority code.
- For the Syslog Severity drop down menu, chose the Severity that defines the severity level of the Syslog message. This field is used in conjunction with the Facility field to form the syslog message priority code.
- When finished, you can click the Test Syslog button to confirm that the Syslog message is received by appropriately by the Syslog server.
- Click Save when ready to enable this configuration.
Appendix
Macro Substitution
The notification Subject field supports fourteen Macros that are substituted with the appropriate data for a particular alert when it occurs. The parameters are case sensitive and must be upper case.
- &N: which is replaced by the name of the server/device causing the alert
- &A: which is replaced by the IP Address of the server/device causing the alert
- &W: which is replaced by the name of the Monitoring Rule
- &S: which is replaced by the Status message associated with this failure causing the alert status information is source dependent and differs based upon the watch type.
- For Example:
- ServerWatch: 429 Mb memory free; 2% available
- ProcessWatch: Process not running no restart attempted
- EventLogWatch: Event ID, Source, & Description
- GAAM: The full simulation details log
- For Example:
- &D: which is replaced by the date of the alert
- &T: which is replaced by the time of the alert
- &P: which is replaced by the Server/Device Description
- &O: which is replaced by the Server/Device Notes
- &G: which is replaced by the name of the Group that the Server/Device belongs
- &C: which is replaced by the Group Description
- &R: which is replaced by the Monitoring Rule ‘Description’ text
- &L: which is replaced by the for the Monitoring Rule ‘Severity’ level
- &E: which is replaced by the for the Monitoring Rule Notes
- &V: (only for CounterWatch)is replaced by the Counter value that exceeded the threshold and caused an alert.